Under Review Β· 2026

Chaos in the Text Revealing the Modality Preference in Mixed-Modality Retrievers

1University of the Chinese Academy of Sciences 2Northeastern University 3Tsinghua University 4Nanjing University
*Equal contribution  Β·  †Corresponding author

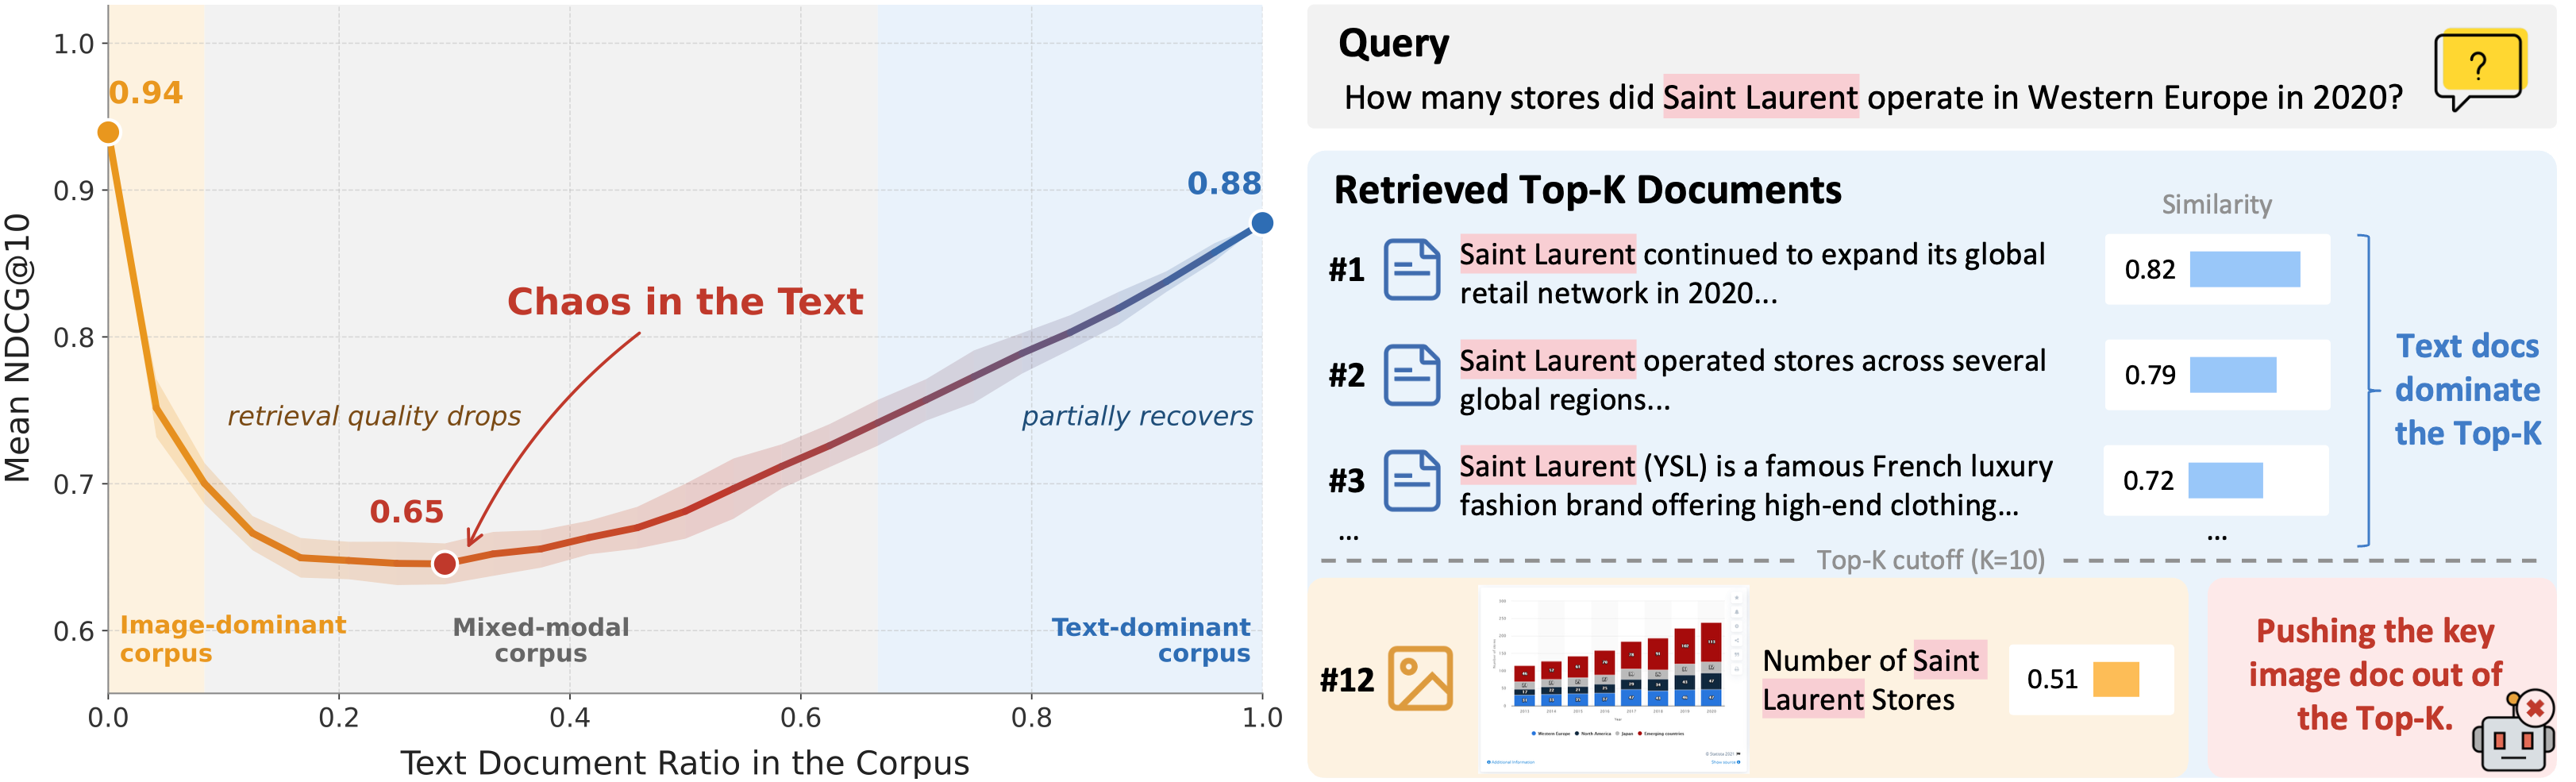
Multimodal retrievers work well on pure-image or pure-text corpora β€” but real corpora mix both. We show that when modalities coexist, retrieval quality collapses along a V-shaped curve, because models systematically over-score text: an irrelevant passage routinely outranks the relevant chart or slide. We call this Chaos in the Text, trace it to a modality preference inside the model, and remove it with Trident, a tri-view contrastive objective.

(a) As image documents are progressively replaced by their text descriptions, NDCG@10 follows an asymmetric V-shaped curve. (b) Chaos in the Text: loosely related text documents take every top-K slot, while the chart holding the answer is pushed to rank #12.
TL;DR

Three findings, one fix

01

Mixing modalities breaks retrieval

Across 9 CLIP- and VLM-based retrievers, NDCG@10 is strong on single-modality corpora but drops sharply β€” up to βˆ’29 pts β€” once text and image documents coexist.

0.94β†’0.65image-only β†’ mixed corpus
02

Text is systematically over-scored

For the same document, the text version scores far higher than the image version. An irrelevant text document beats the relevant image for up to 100% of queries.

94.6%queries where irrelevant text outranks the relevant image (Jina-CLIP-v2)
03

Trident removes the preference

Training with text / image / fused views as co-equal positives in one shared softmax flattens the V, closes the similarity gap, and improves single-modality scores too.

40.1β†’73.9Mix-corpus avg NDCG@10, Qwen3-VL-2B
Part 1 Β· The Phenomenon

How do retrievers behave on mixed-modality corpora?

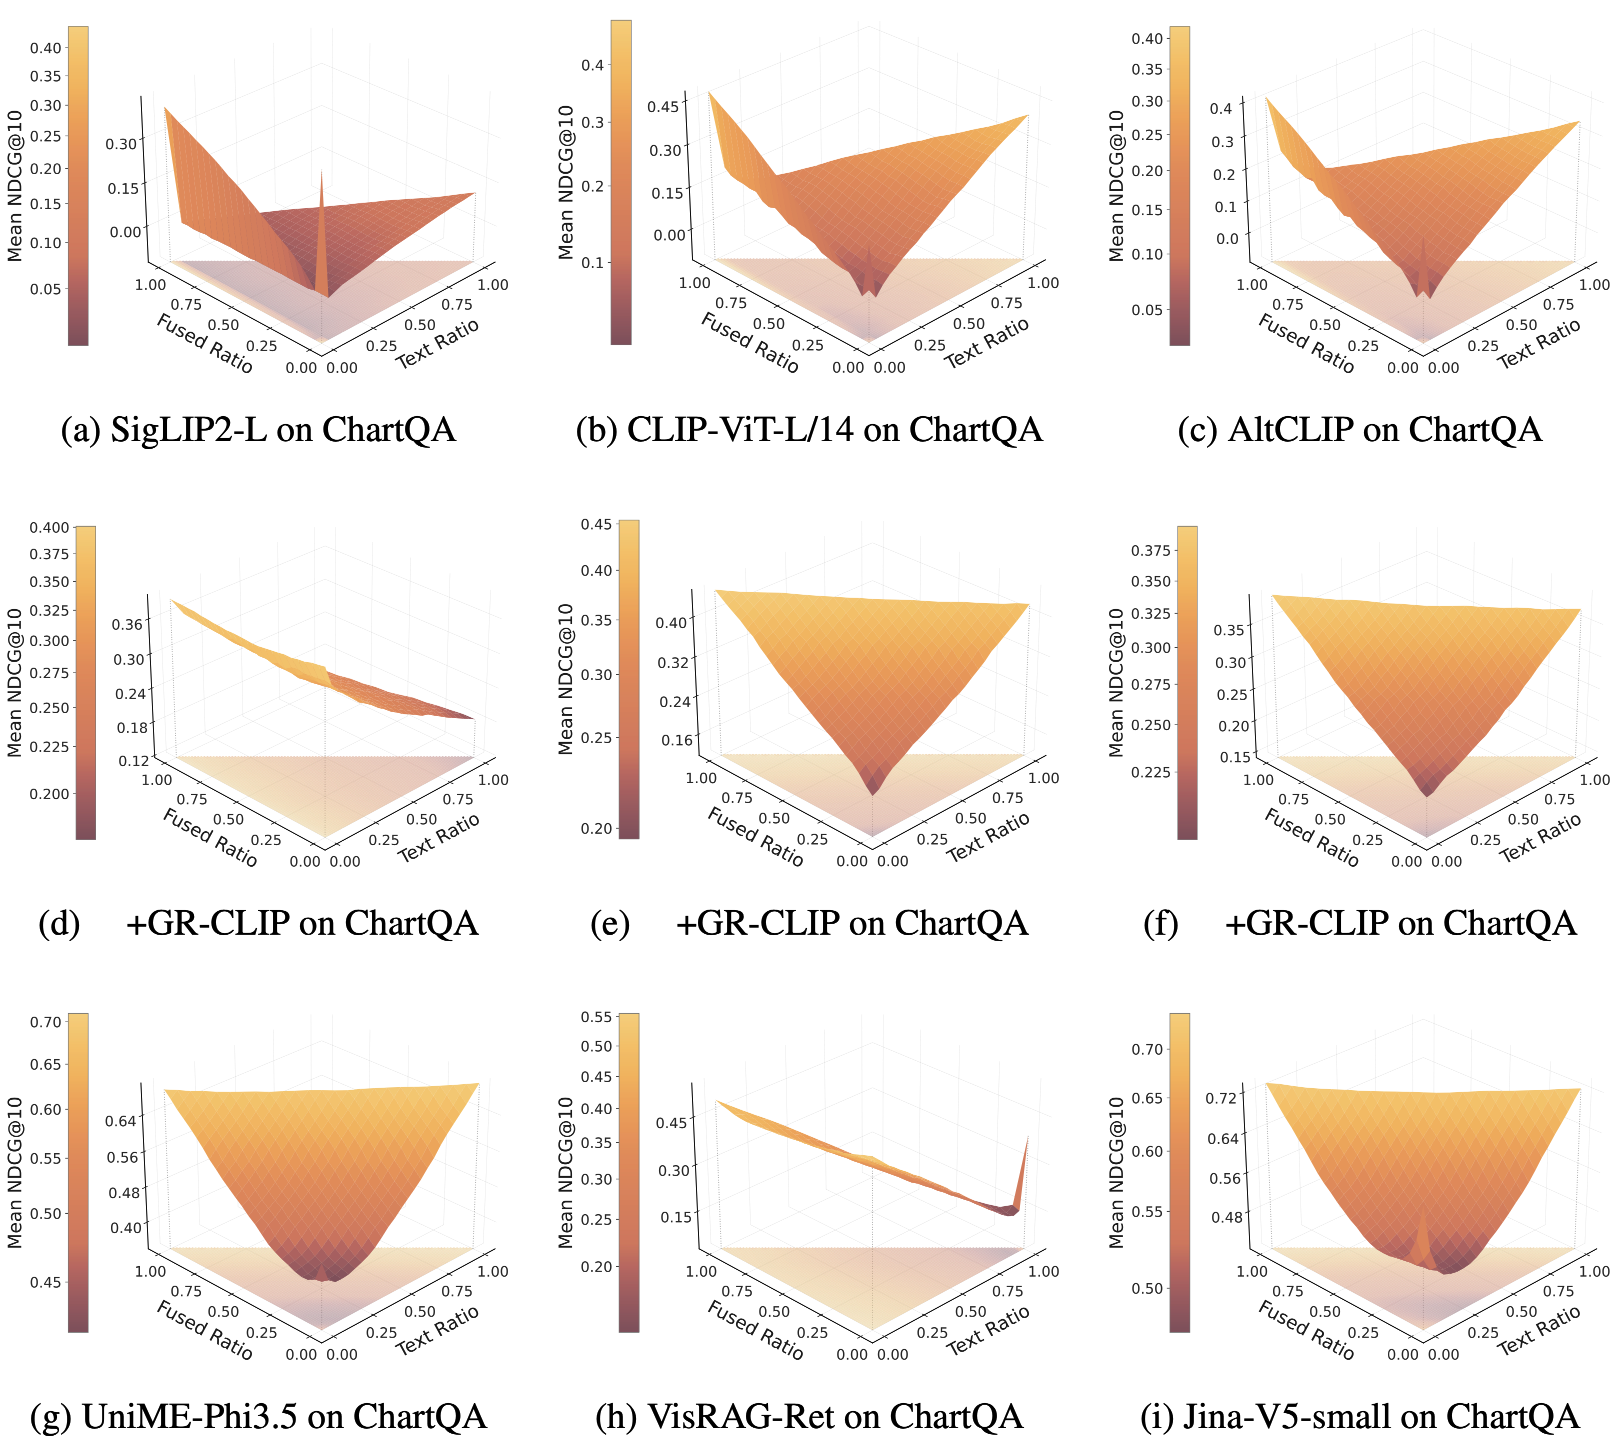
We take an image corpus (ChartQA, SlideVQA) and, for each document, build three semantically matched views with Qwen3-VL-235B: a Text view (detailed description), an Image view (original), and a Fused view (image + short summary). Sampling one view per document at controlled ratios keeps the content fixed and changes only the modality composition.
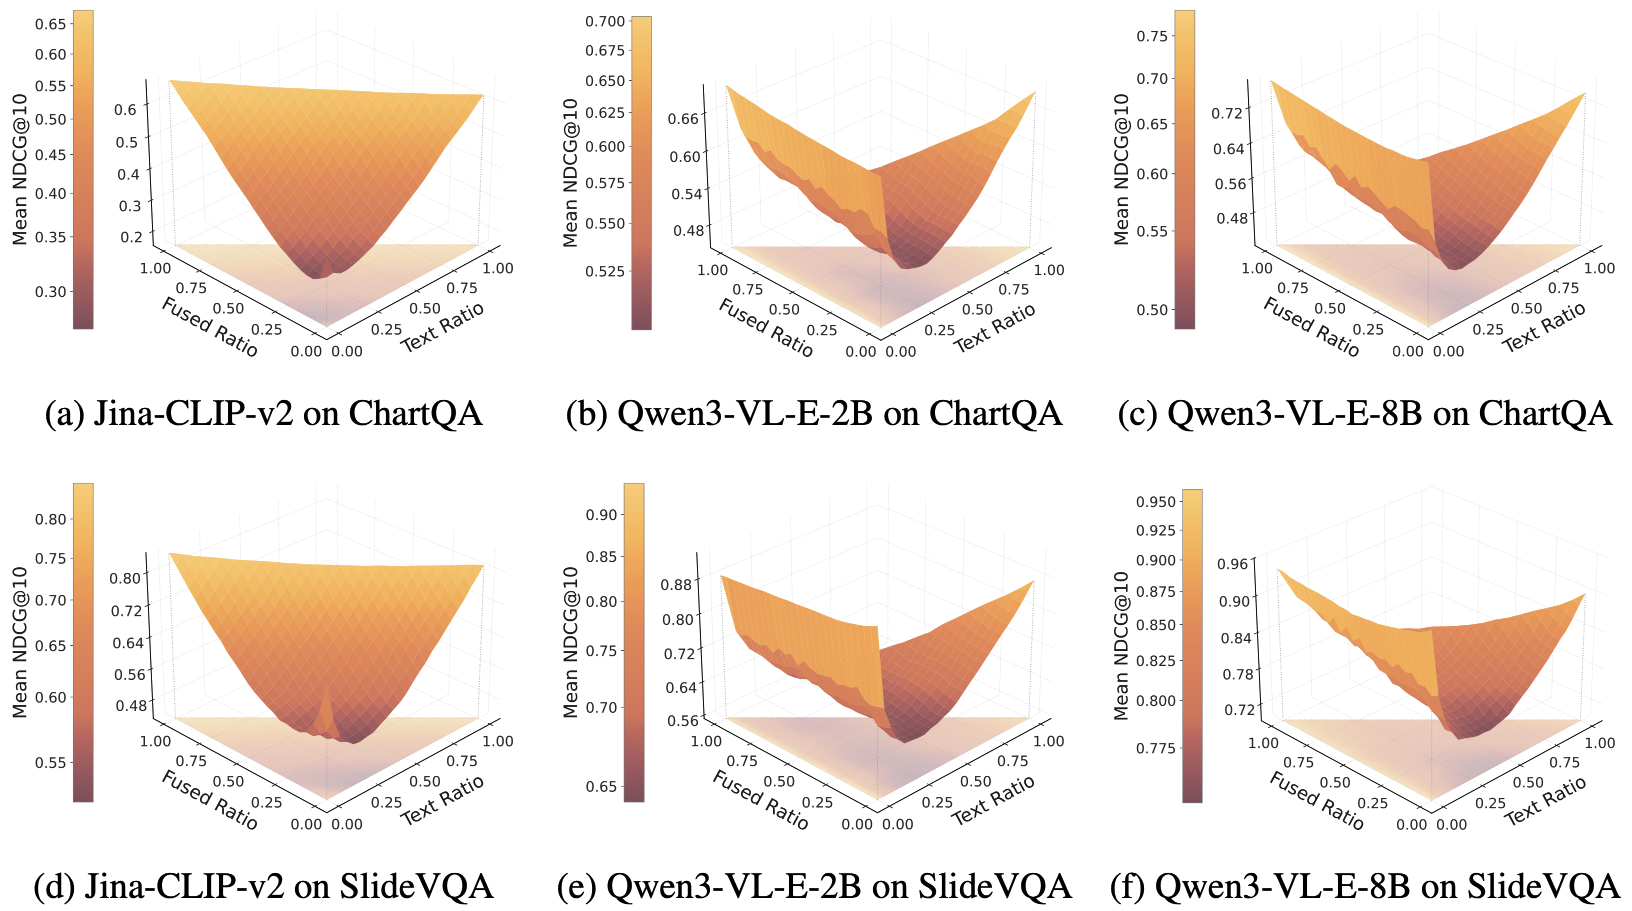
🎚 Slide the corpus from all-image to all-text

Image Text
Text ratio0%
Mean NDCG@100.94
ZoneImage-dominant
Show the static figure from the paper (Fig. 2 + Appendix Figs. 8–9)
Figure 2
Figure 8
Figure 9

β€œChaos in the Text”

Is the drop simply because the candidate pool got bigger? We add equal numbers of irrelevant Wikipedia text passages or images to the original image corpus.

Irrelevant images barely hurt. Irrelevant text causes a sharp collapse β€” at 50k distractors the gap reaches Ξ” 0.31–0.51 NDCG@10 across models. Pool size alone cannot explain this: modality is steering the ranking.
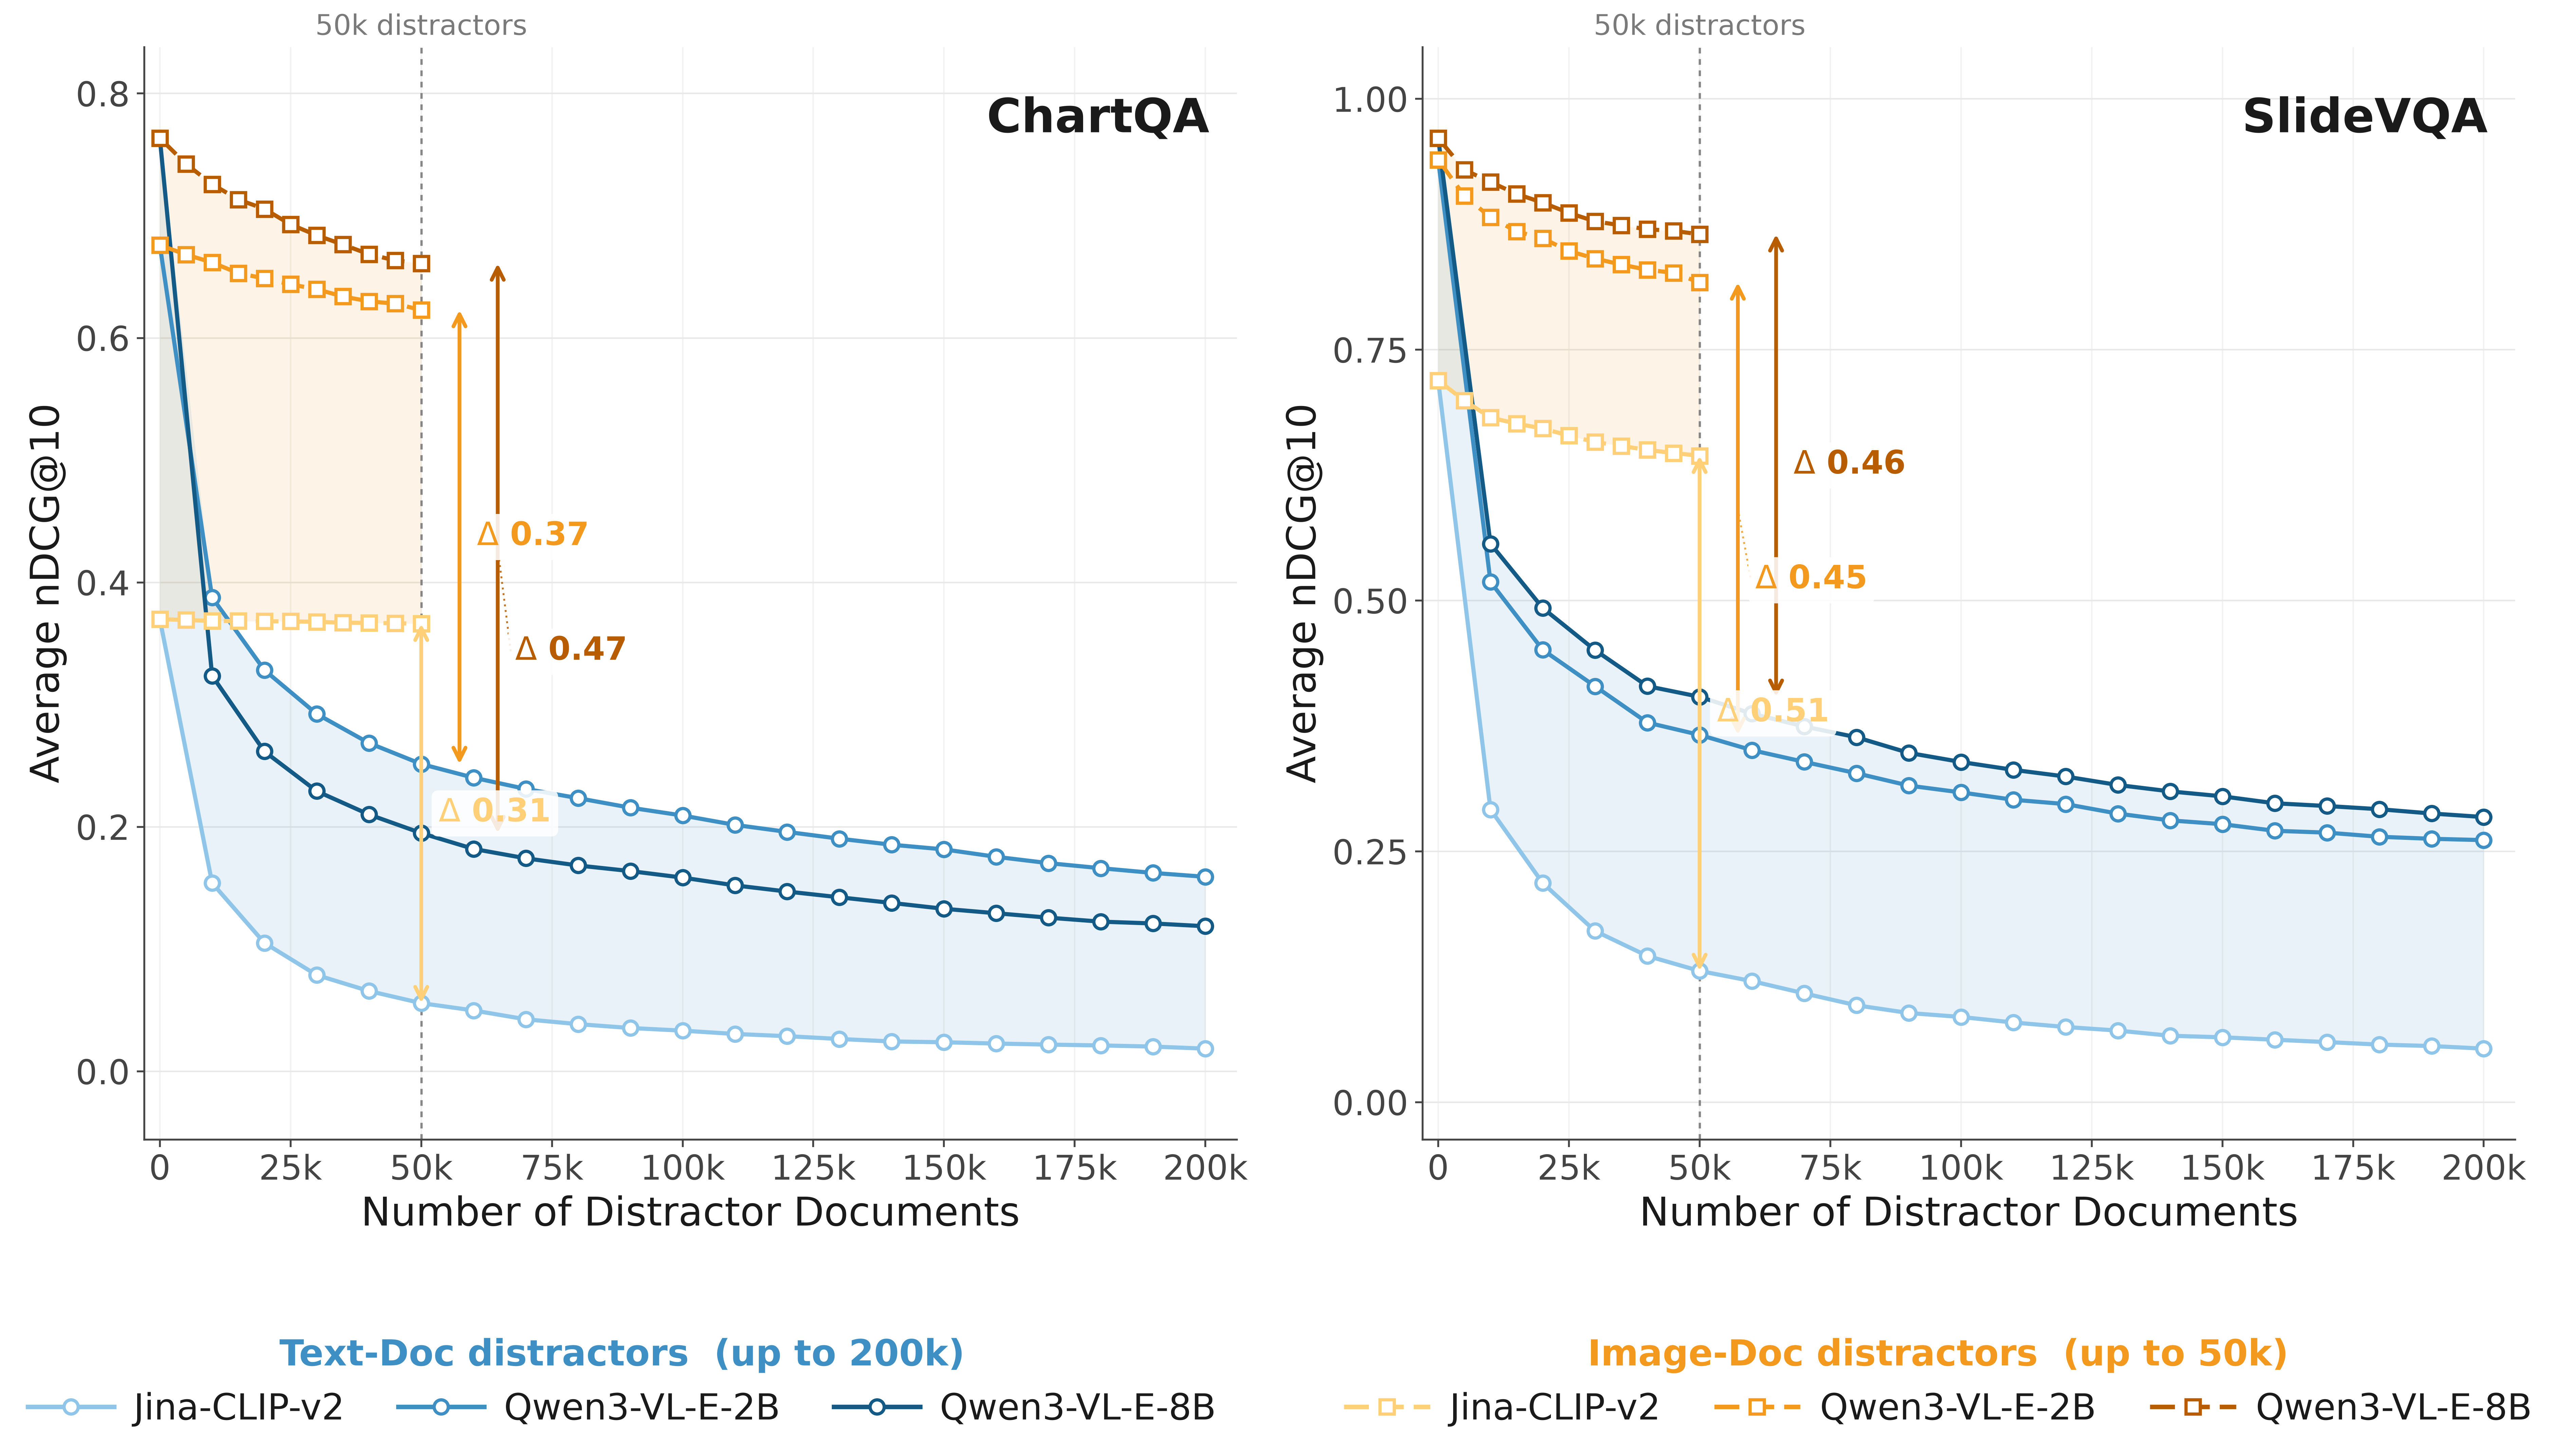
Key takeaway. Strong single-modality performance does not guarantee reliable retrieval once text and images share one ranked list.
Figure 3
Text distractors (blue) degrade NDCG@10 far more than the same number of image distractors (orange).
Part 2 Β· The Cause

Why does text win? Modality preference.

We score the same queries against three semantically identical corpora (pure text, pure image, fused). If ranking depended only on relevance, the positive-pair similarity should not depend on the modality. It does β€” strongly.

πŸ“Š Positive similarity & interference rate by document modality

β‘  Relevant docs are scored by modality

For every model, text positives get the highest similarity, image positives the lowest, fused in between β€” e.g. SigLIP2-L: 0.777 (text) vs 0.141 (image) for the same content.

β‘‘ The bias flips rankings

Plotting each query's positive score against its strongest irrelevant text, most image-positive queries lie above y = x: the irrelevant text wins. Fused views help, but only partially.
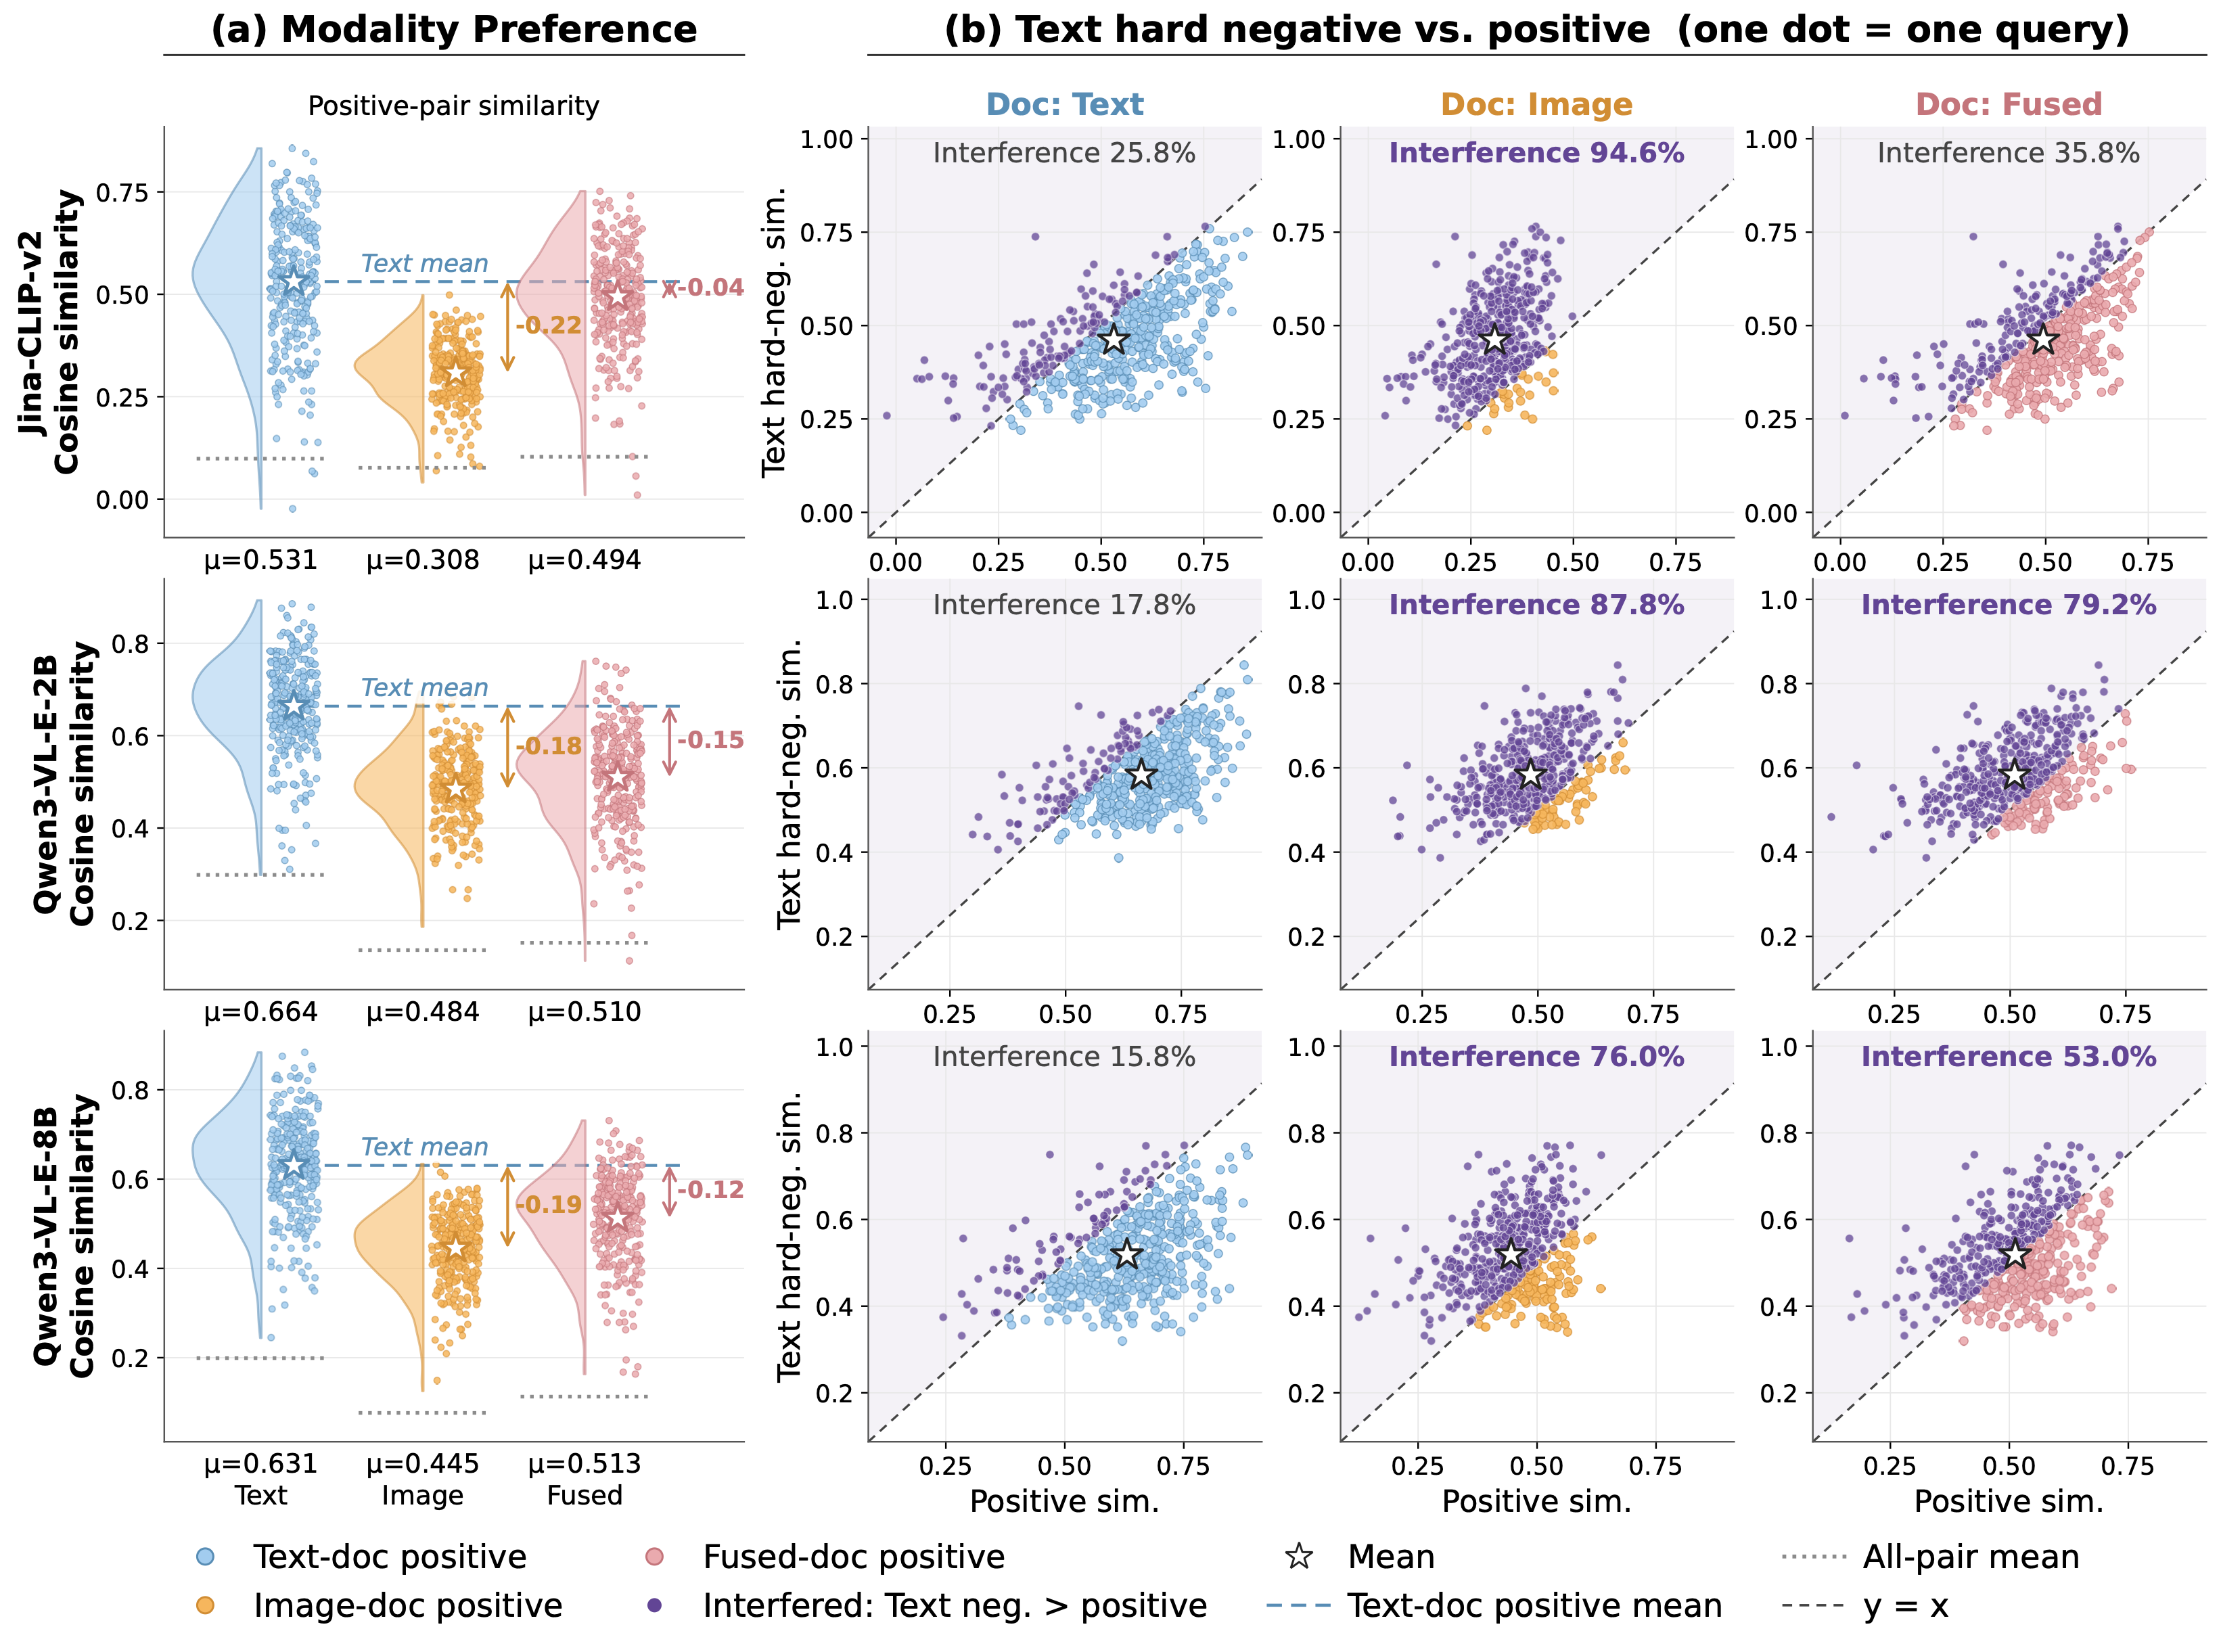
Paper figure: violin plots + per-query scatter (Fig. 4)
Figure 4

Points above the diagonal = queries where an irrelevant text document outranks the relevant one. More models in Appendix Figs. 11–12.
Not the classic β€œmodality gap”. Prior work studies a geometric offset between image and text embeddings, which is harmless when all candidates share one modality (the offset cancels in ranking). In mixed corpora, what corrupts ranking is a modality preference in the scores themselves. Post-hoc calibration (GR-CLIP) shrinks but does not remove it.
Part 3 Β· The Fix

πŸ”± Trident: three co-equal positive views, one shared softmax

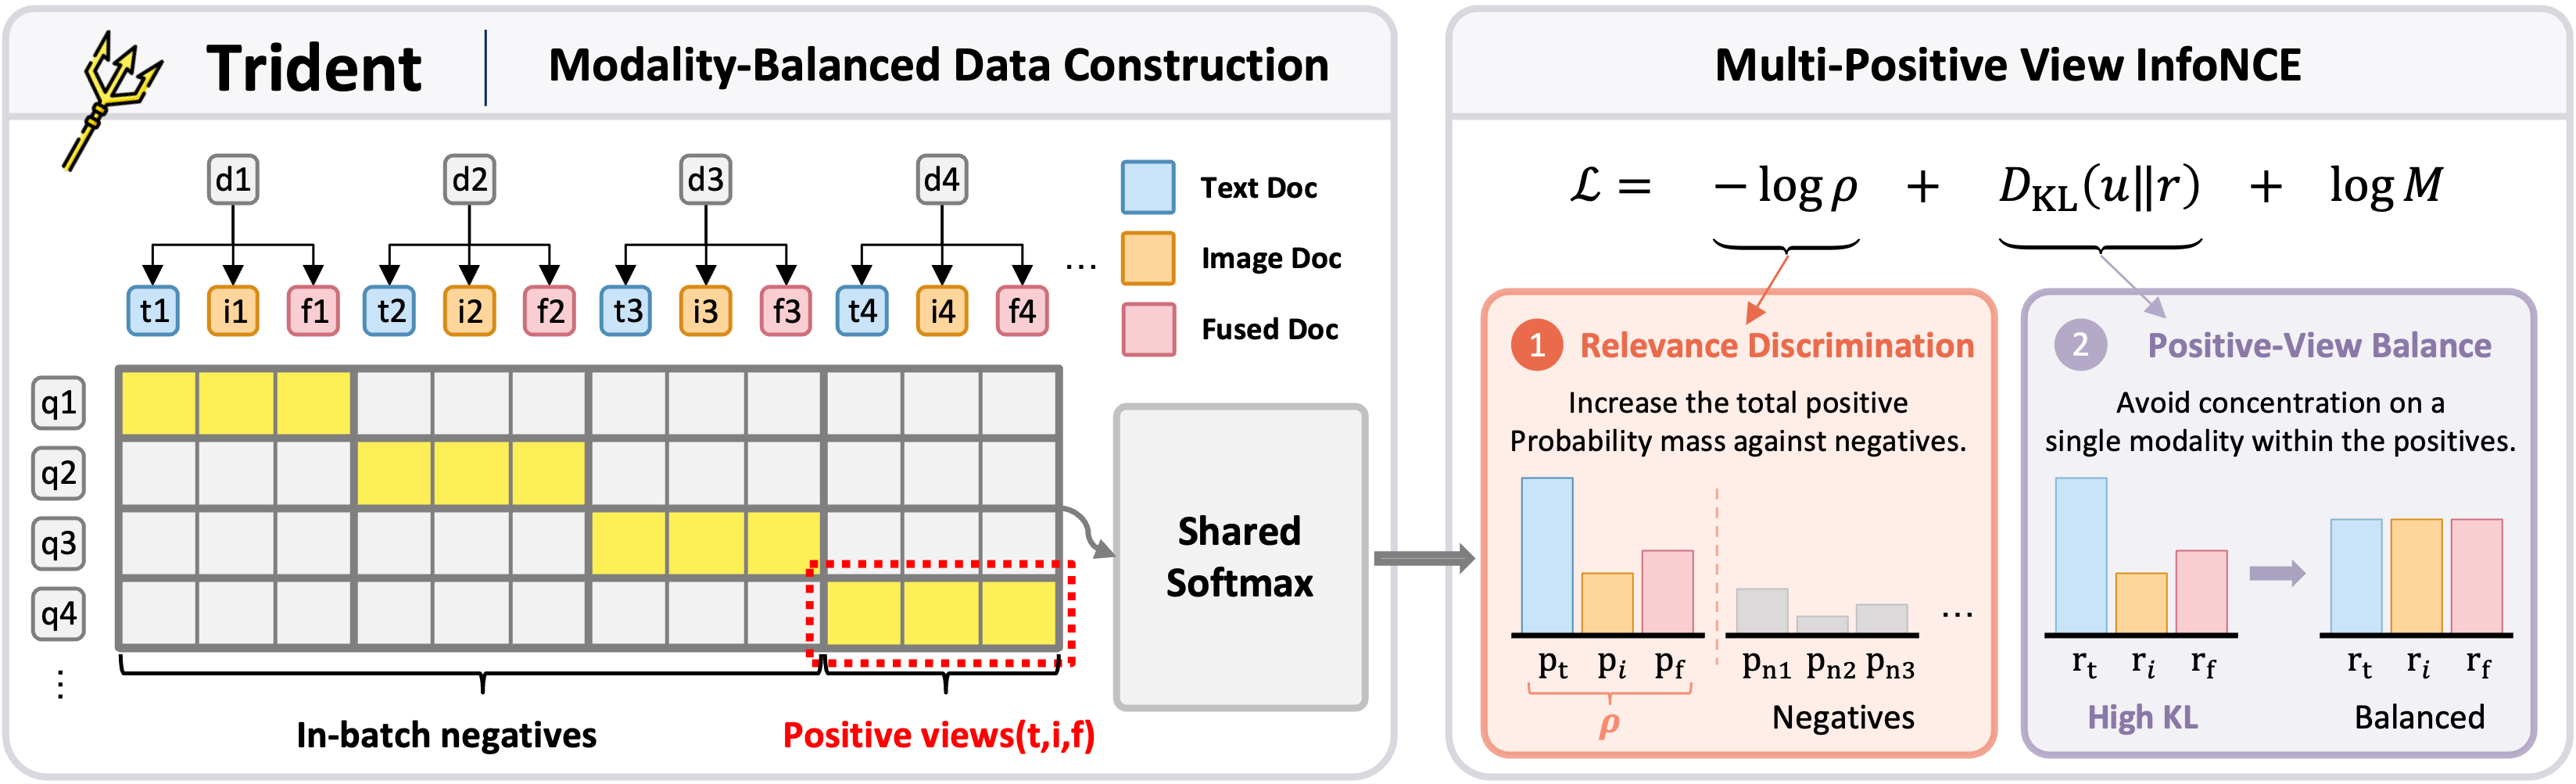
Figure 5: Trident overview
Left: each document yields text, image and fused views; all other views in the batch are negatives. Right: the objective decomposes into relevance discrimination and positive-view balance.
1

Modality-balanced data

For each image document, Qwen3-VL-235B writes a detailed description (Text) and a short summary paired with the image (Fused). With the original Image, a single-positive pair becomes a three-view pair.

2

Why per-modality InfoNCE is not enough

A separately normalised loss is invariant to adding a modality-wide offset c_m(q) β€” it learns rankings within a modality but never fixes the score baselines across modalities.

$$\frac{e^{(s_m^+ + c_m)/\tau}}{\sum_{d\in\mathcal D_m} e^{(s_m(q,d)+c_m)/\tau}} = \frac{e^{s_m^+/\tau}}{\sum_{d\in\mathcal D_m} e^{s_m(q,d)/\tau}}$$
3

Multi-Positive View InfoNCE

Put all three positives and all negatives in one softmax denominator, and average their log-probabilities:

$$\mathcal L_{\text{trident}}(q) = -\frac{1}{|\mathcal P|}\sum_{p\in\mathcal P}\log\frac{\exp(\mathrm{sim}(q,p)/\tau)}{\sum_{j\in\mathcal P\cup\mathcal N}\exp(\mathrm{sim}(q,j)/\tau)}$$

which decomposes exactly into

$$\mathcal L_{\text{trident}} = \underbrace{-\log\rho}_{\text{relevance discrimination}} \;+\; \underbrace{D_{\mathrm{KL}}(u\,\|\,r)}_{\text{positive-view balance}} \;+\; \log M$$

ρ = total probability on positives; r = each view's share within the positives; u = uniform (1/3 each). The first term separates relevant from irrelevant; the second stops any single modality β€” usually text β€” from monopolising the positive mass.

πŸ§ͺ Loss playground β€” watch the shared softmax rebalance a single query

Live computation of Eq. (4)–(6) and the gradients in Appendix E
Positive views (same document)
Negatives
ρ (positive mass)–
βˆ’log ρ–
KL(uβ€–r)–
Loss–

Bars show softmax probability pj; arrows show the gradient-descent direction on each score, βˆ’βˆ‚L/βˆ‚sj = (πŸ™[j∈P]/M βˆ’ pj)/Ο„. Under-weighted positives (usually the image) are pushed up; the over-weighted text positive and high-scoring negatives are pushed down.

Part 4 Β· Results

Better on mixed corpora β€” and on single-modality ones

+33.8
Mix avg gain over Qwen3-VL-E-2B
40.12 β†’ 73.90
+12.8
Mix avg gain over Jina-CLIP-v2
42.68 β†’ 55.51
+26.7
2B Trident vs 8B baseline (Mix)
73.90 vs 47.17
+2.9
Origin avg gain (no trade-off)
77.59 β†’ 80.51

πŸ“‹ Visual document retrieval β€” six benchmarks (NDCG@10)

Origin: each dataset's original image-only corpus. Mix: all corpora converted to mixed modality and merged into one pool. Bold = best, underline = second best within each model family. Hover a row to highlight it.

πŸ“‰ Origin β†’ Mix: who survives the mixed corpus?

Average NDCG@10 over six benchmarks

Each line connects a model's Origin score (β—‹) to its Mix score (●). Most baselines lose 10–37 points; Trident models gain or hold.

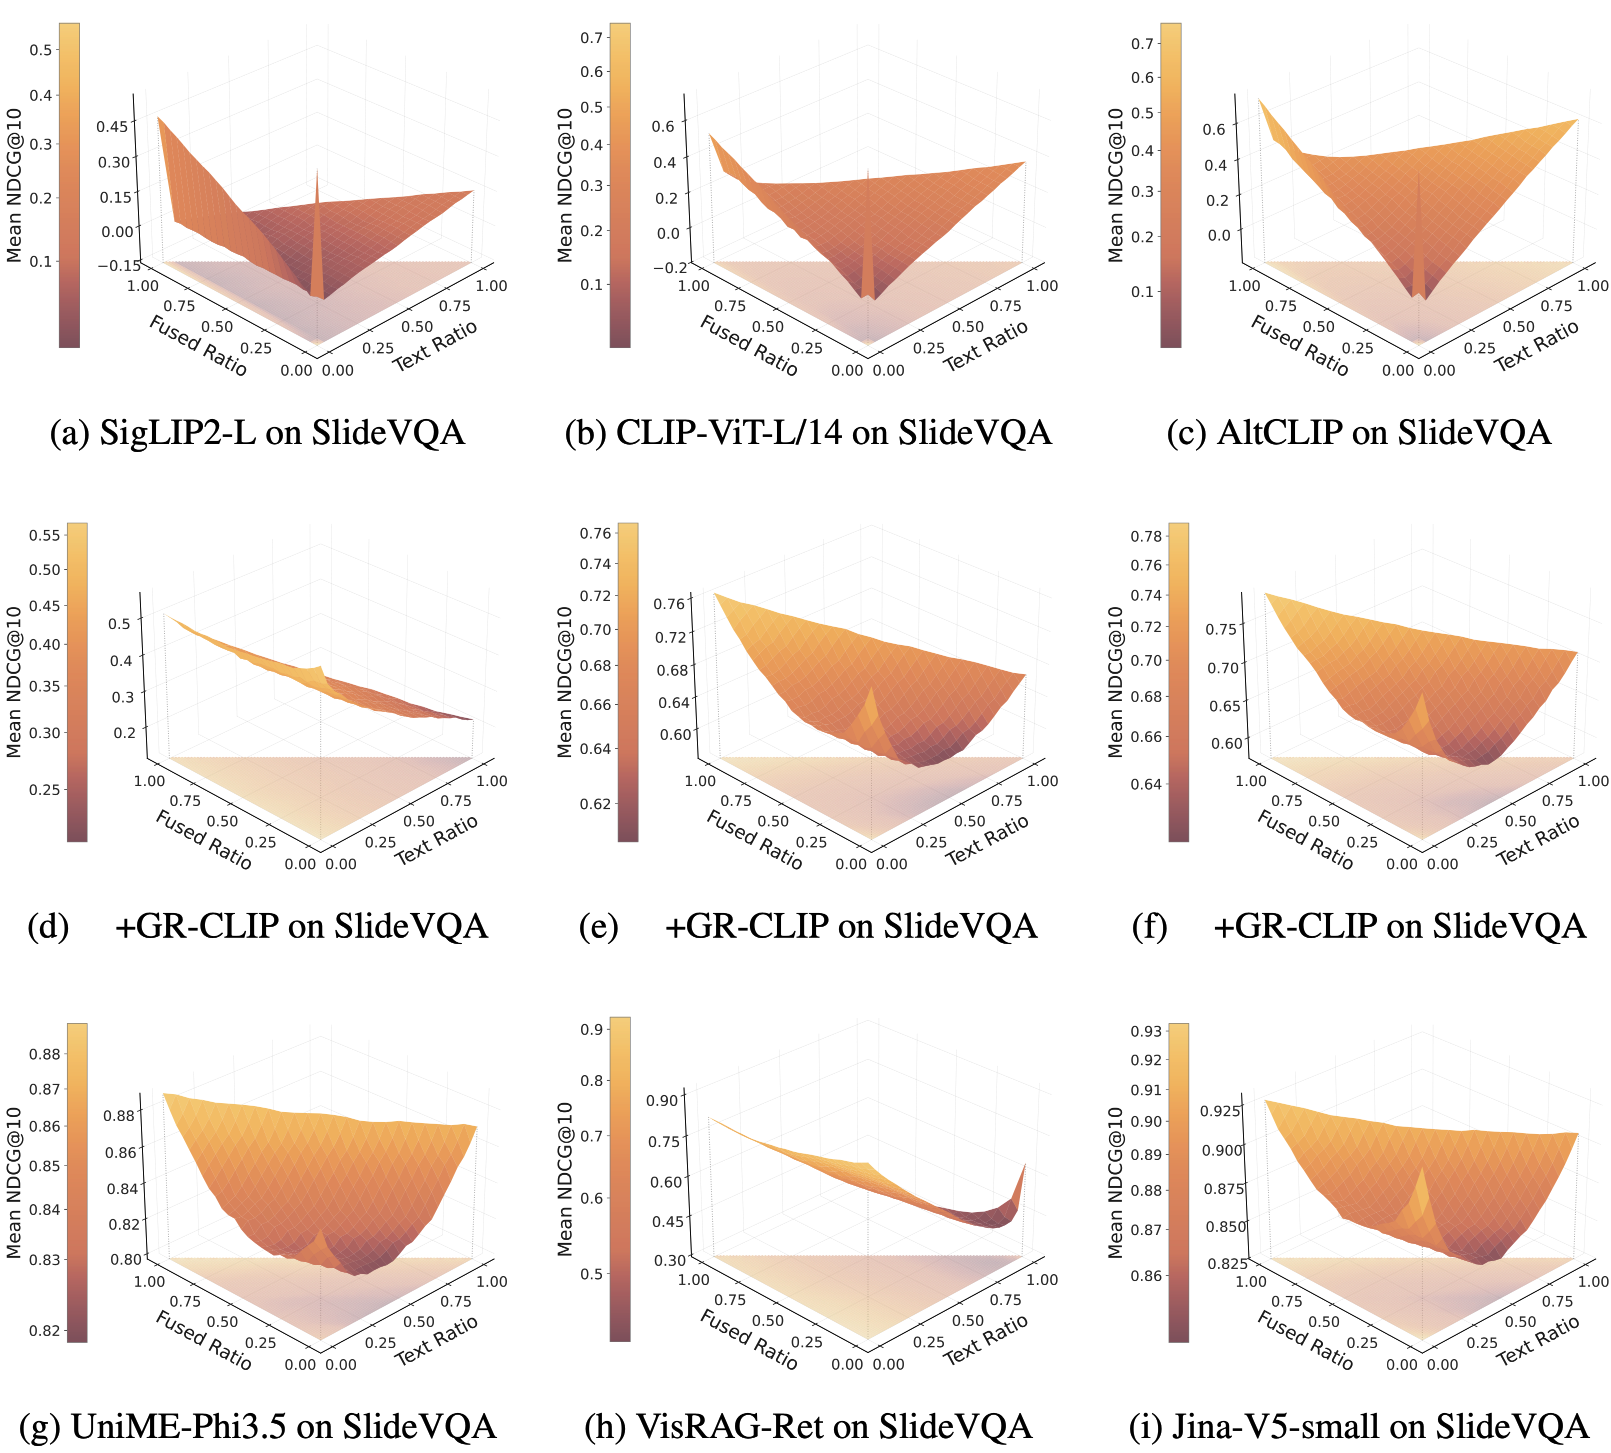
🧭 Explore the full composition surface (text Γ— fused Γ— image)

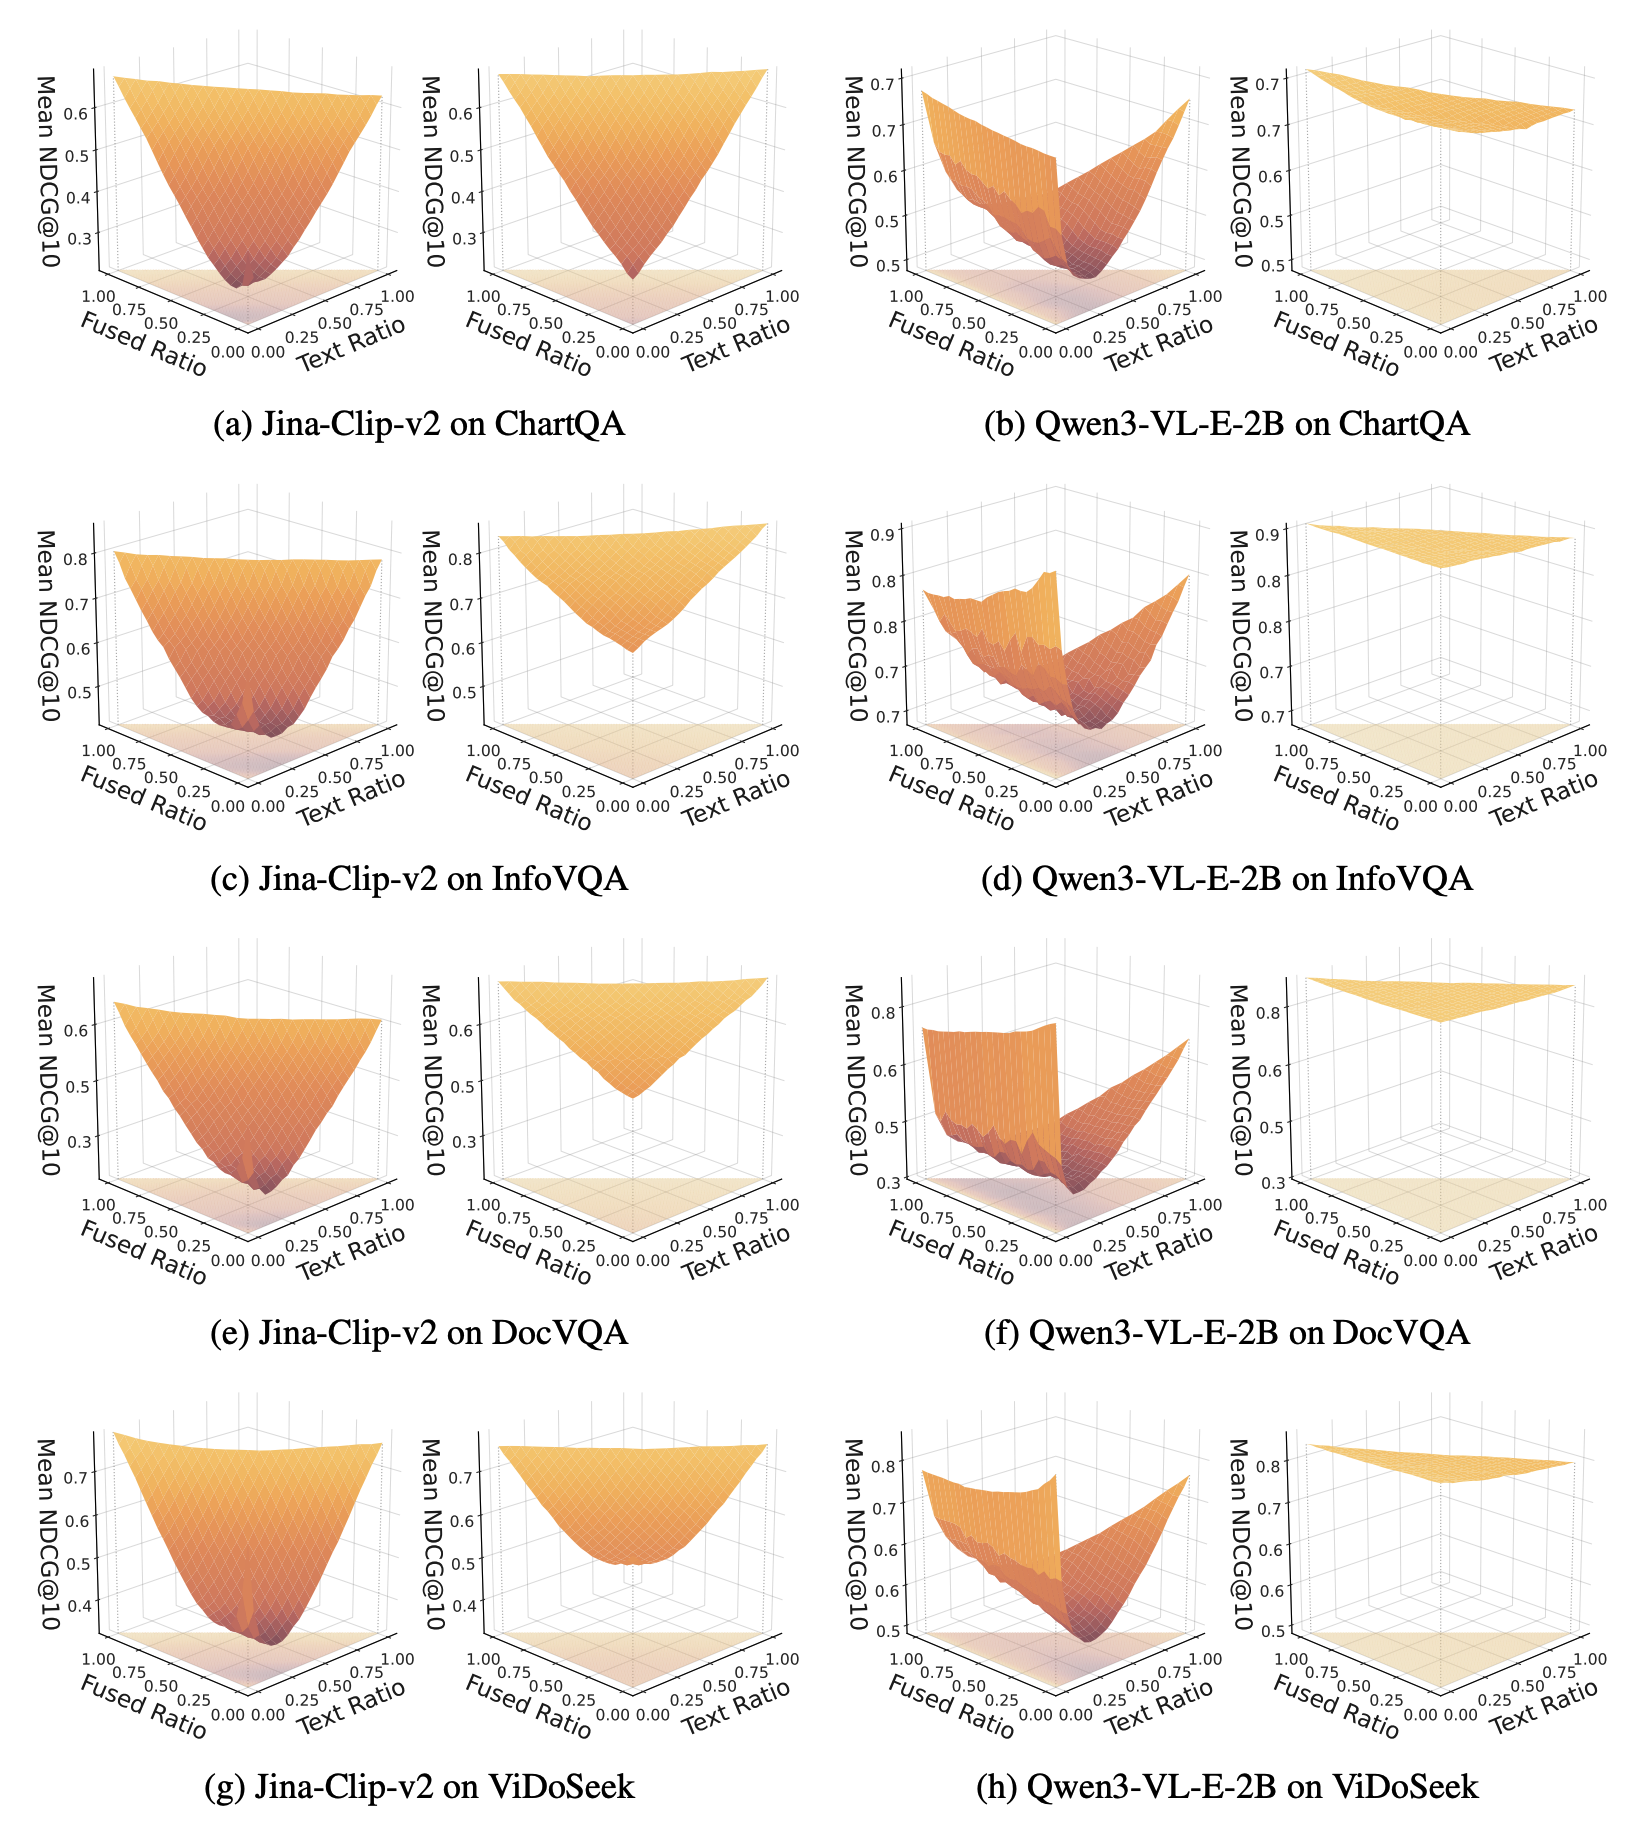
Drag to rotate, hover for exact values. Image ratio = 1 βˆ’ text βˆ’ fused; the corner (0, 0) is the original image-only corpus. The valley sits where text-only and image-only documents coexist; adding fused documents (moving toward the fused axis) softens it.

Same comparison on ChartQA, InfoVQA, DocVQA, ViDoSeek (Fig. 16)
Figure 16

Text distractors no longer dominate

Under the same distractor protocol as the phenomenon study, Trident-Qwen3VL-2B keeps its text- and image-distractor curves close together: the gap shrinks to Ξ” 0.06 on ChartQA and Ξ” 0.03 on SlideVQA, versus 0.15–0.27 for strong VLM baselines.
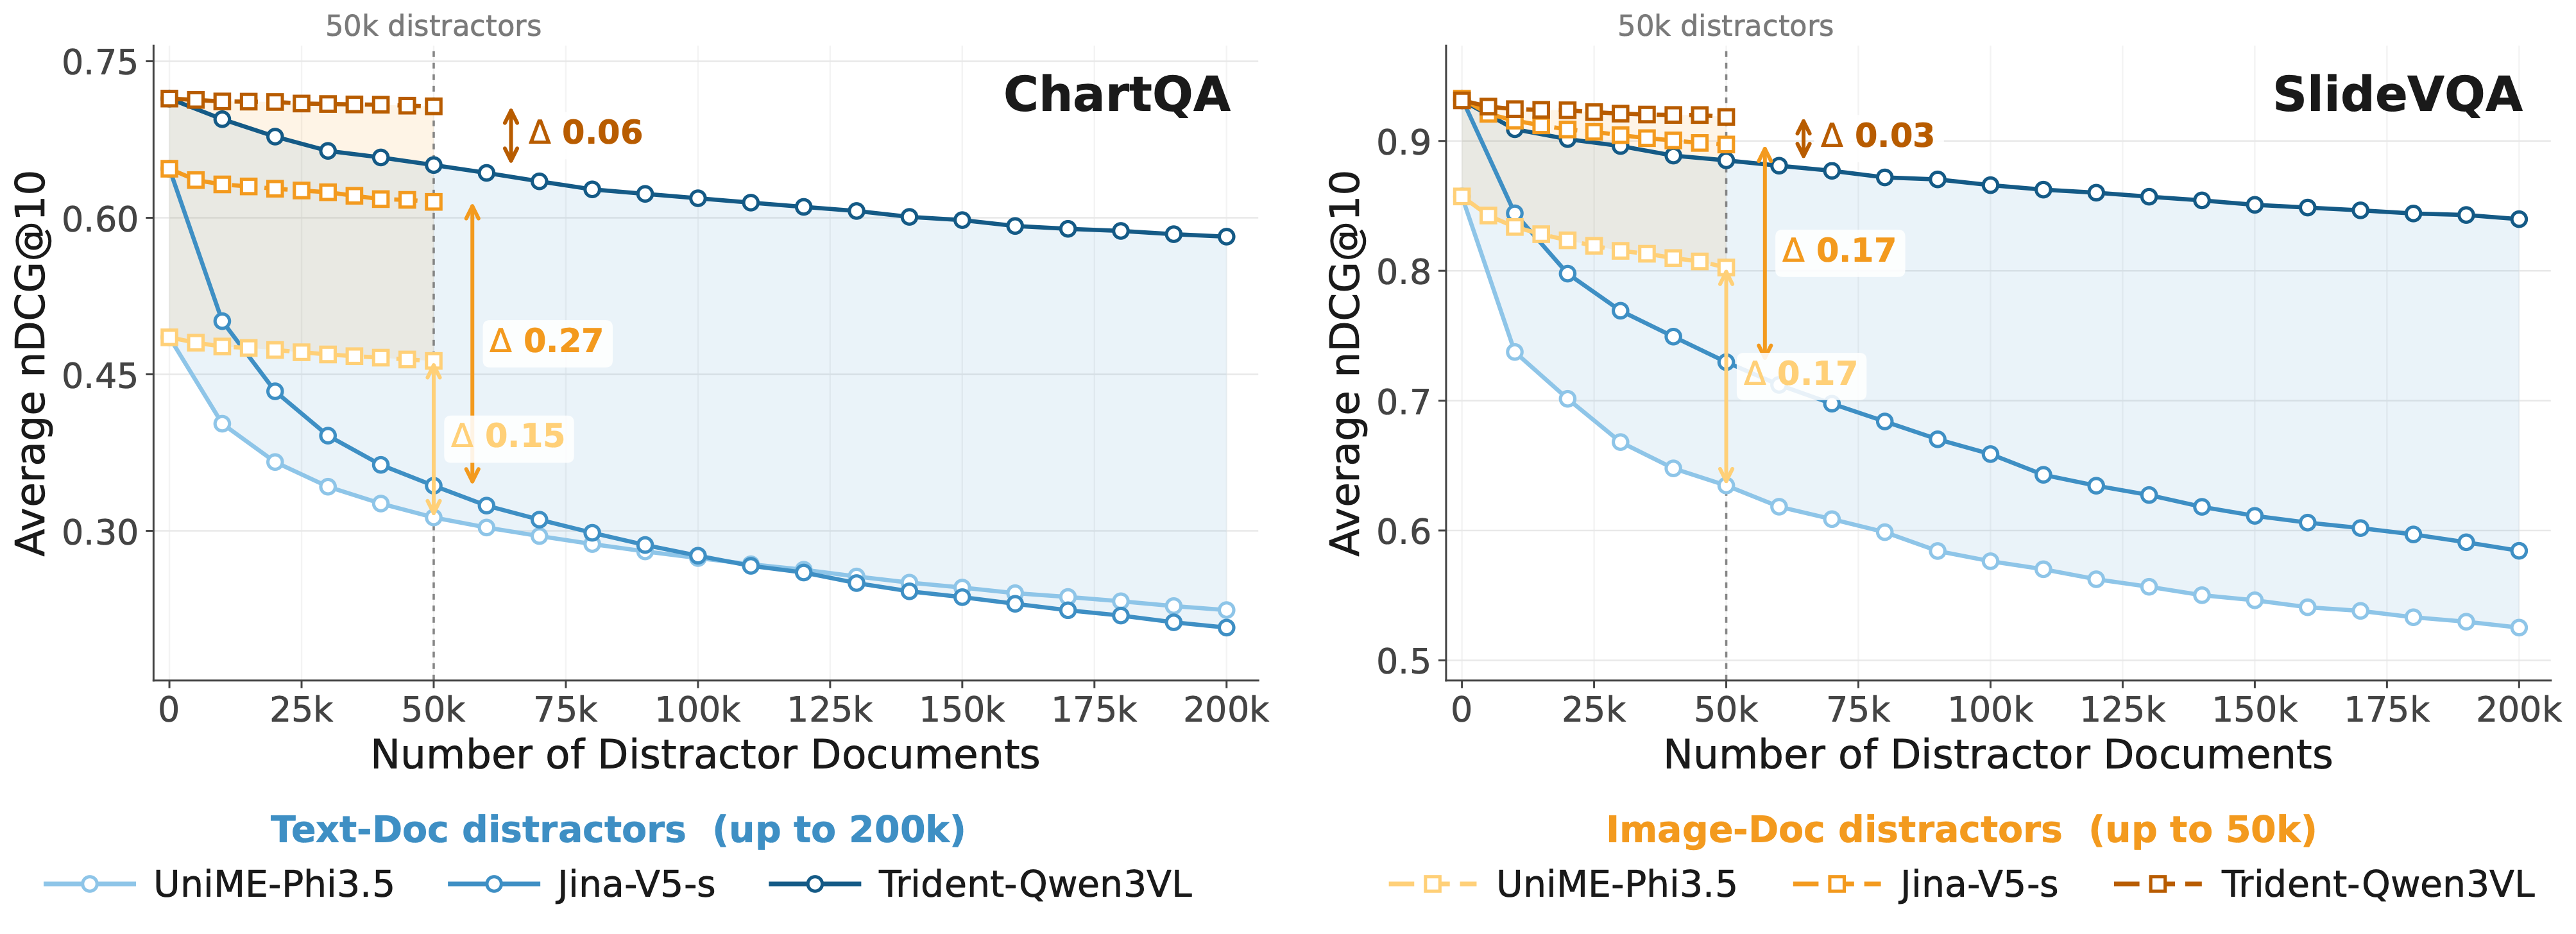
Figure 10 bottom row
Part 5 Β· Analysis

What changed inside the model?

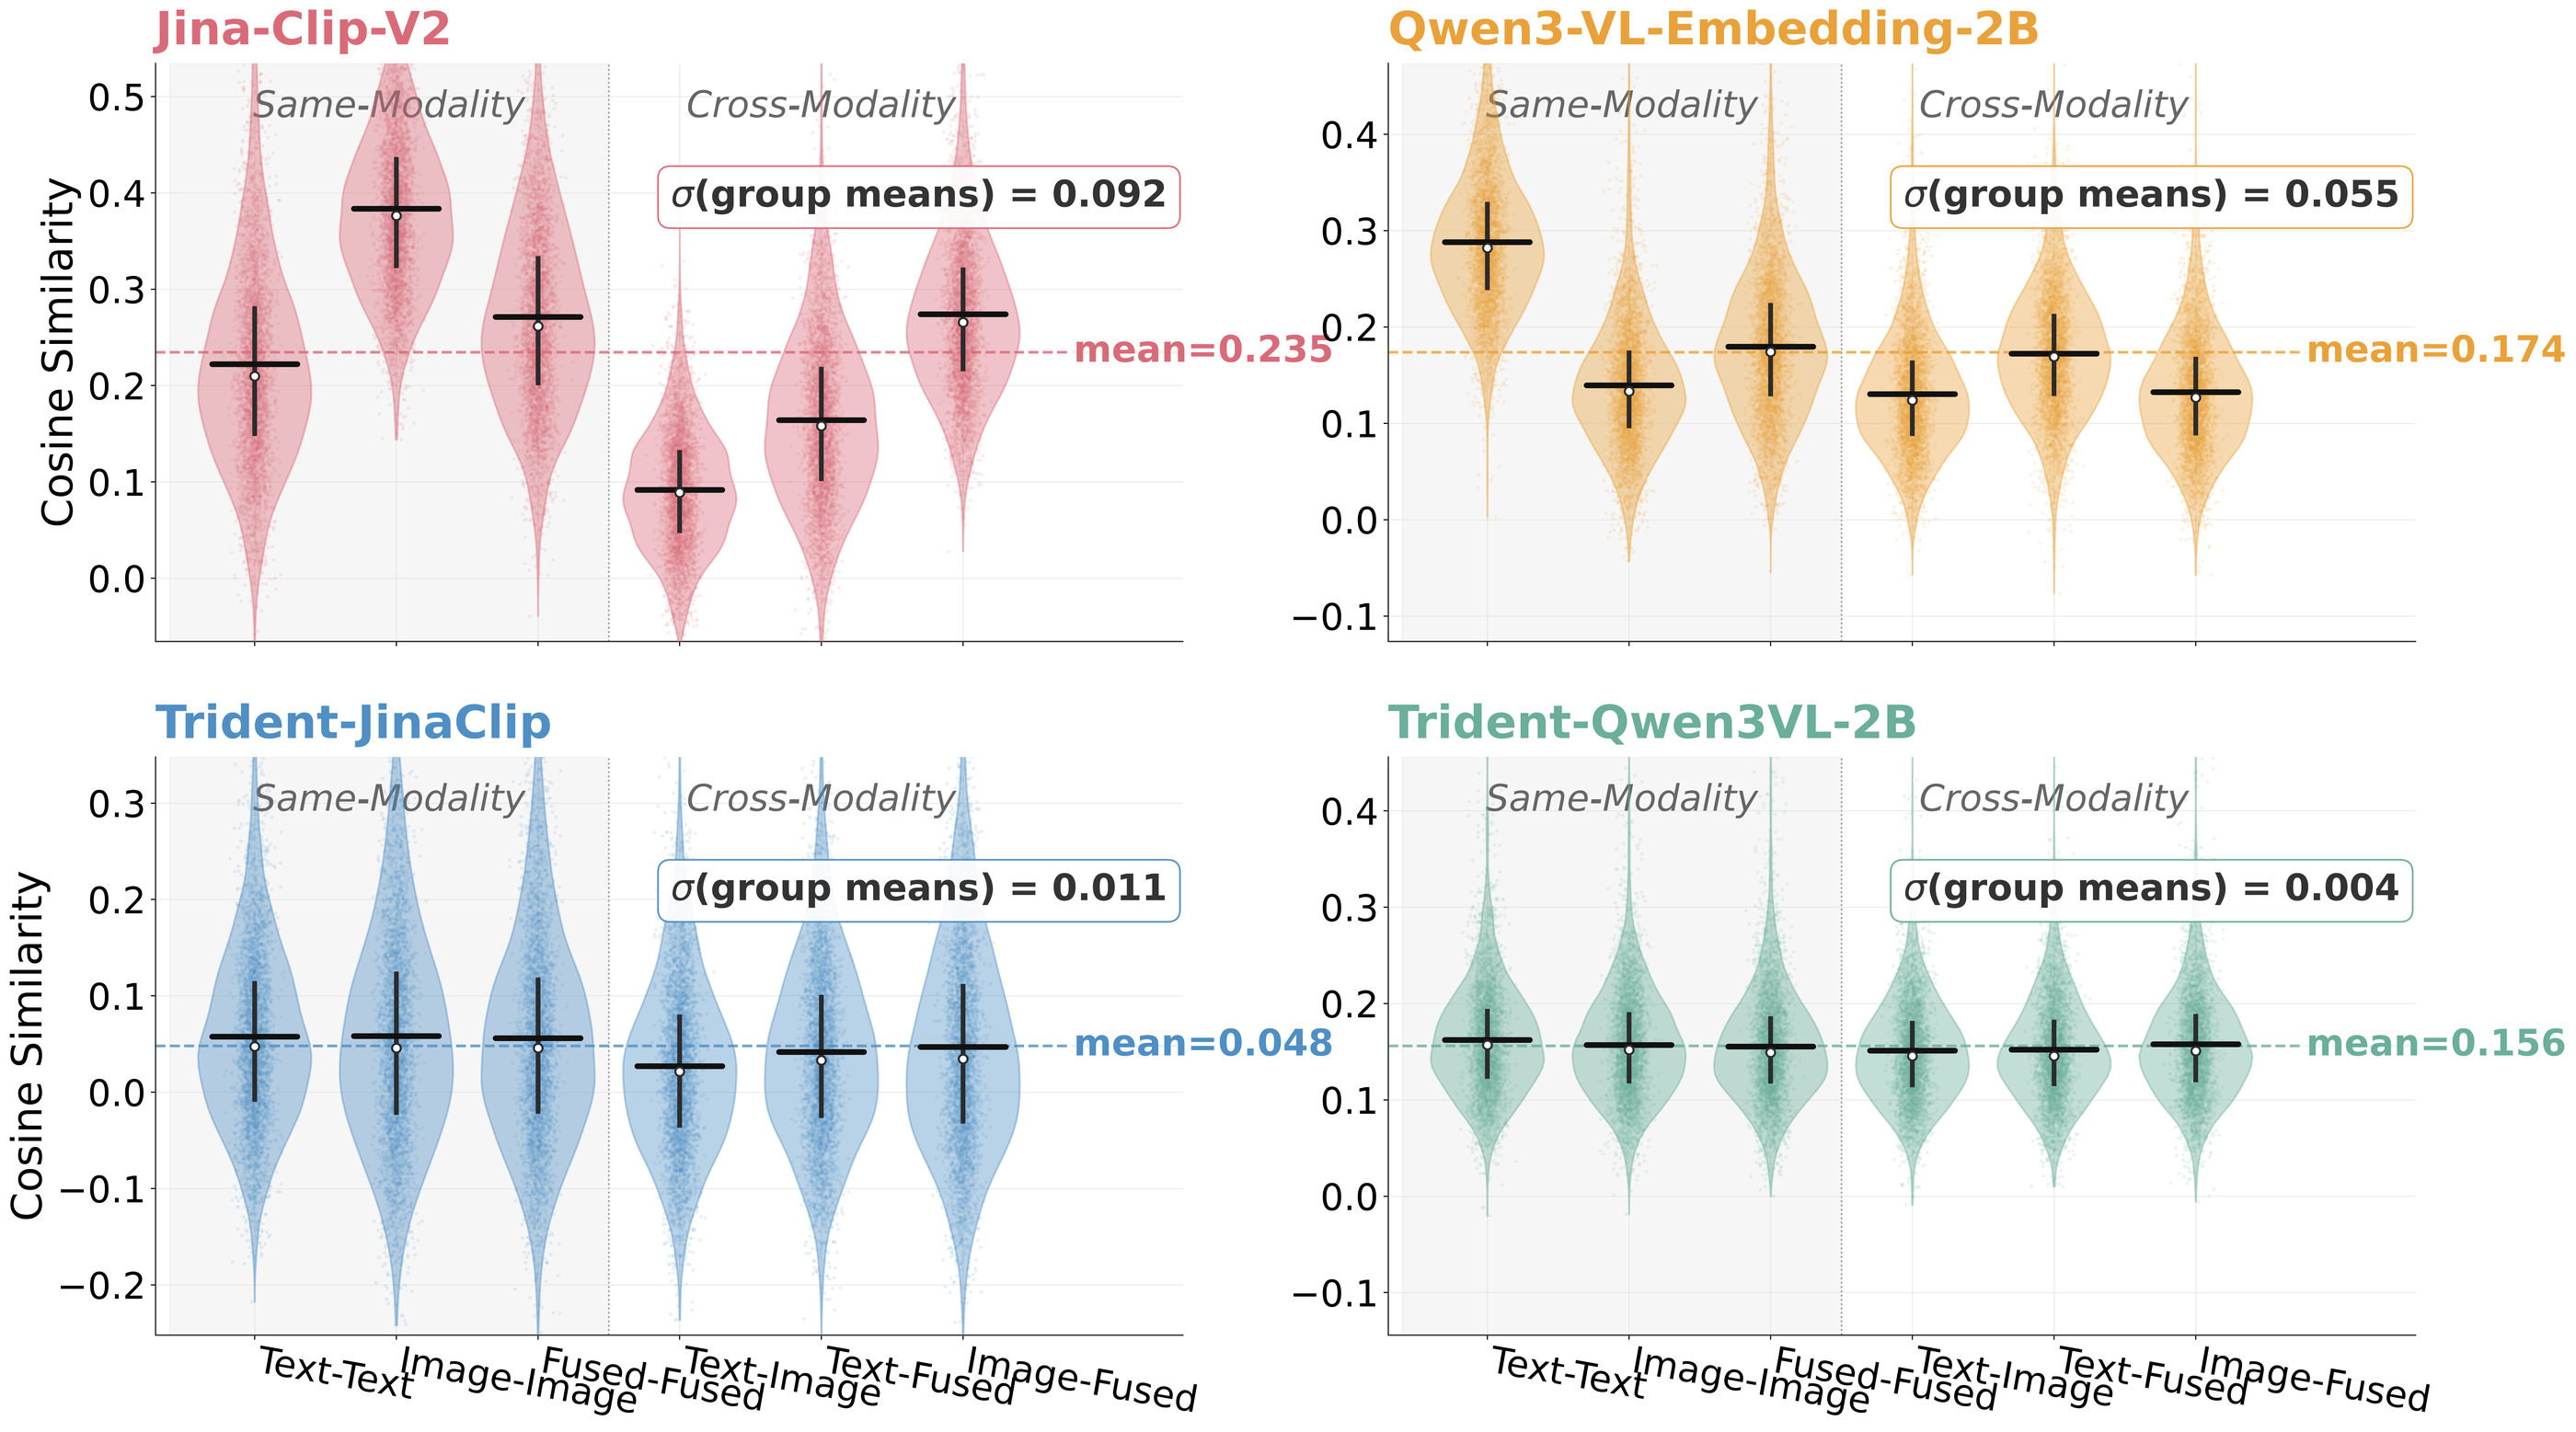
Figure 7

Similarity distributions converge

Before training, same-modality vs cross-modality positive pairs have very different centres (Jina-CLIP-v2 favours Image–Image, Qwen3-VL favours Text–Text). After Trident, the six group means align.

Jina-CLIP-v20.092 β†’ 0.011
Qwen3-VL-E-2B0.055 β†’ 0.004

Οƒ of the six group means (lower = less modality-dependent).

Ablation: data balance and objective are complementary

Qwen3-VL-E-2B
Οƒ = 0.055
Mix 40.12
β†’
+ balanced data
(w/o Multi-Pos. InfoNCE)
Οƒ = 0.009
Mix 66.36
β†’
+ Multi-Pos. InfoNCE
(Trident)
Οƒ = 0.004
Mix 73.90
β†’
+ explicit balance loss
(w = 200)
Οƒ = 0.003
slightly lower NDCG
Balance β‰  equal similarity. Forcing the three views to have identical cosine similarity further lowers Οƒ but does not improve retrieval: the views carry genuinely different information. What matters is that no single modality systematically dominates the shared softmax.
Citation

BibTeX

@article{sun2026chaos,
  title={Chaos in the Text: Revealing the Modality Preference in Mixed-Modality Retrievers},
  author={Sun, Yubo and Peng, Chunyi and Yan, Yukun and Liu, Zhenghao and Xu, Zhipeng and Mei, Sen and Xin, Linlin and Zeng, Zheni and Sun, Maosong},
  journal={arXiv preprint arXiv:2610.11816},
  year={2026}
}